
Example case study: how a retailer chose a data analytics partner
Illustrative example: a fictional retailer and fictional figures, showing how an AiPartner case study can combine a guided story, results, a timeline, images and video.

- The Client / Context
- A mid-sized retailer (illustrative example)
- Industry
- Retail & E-Commerce
- Services
- Consulting & Project Delivery
- Need
- A modern analytics platform on Google Cloud
- Selection period
- Six weeks (illustrative)
- Engagement
- Partner-led, phased implementation
The customer
A fictional mid-sized retailer with stores and an online shop. This is an illustrative example: it does not describe a real AiPartner customer, partner or result.
The challenge
Sales, stock and online data lived in separate systems. Weekly reports were assembled by hand, arrived late, and different teams trusted different numbers.
What AiPartner did
AiPartner helped the retailer turn the problem into one structured brief — goals, data sources, constraints, budget range and decision criteria — and shared it with suitable Google Cloud partners so their proposals could be compared on the same terms.
The partner solution
The selected partner proposed a phased move to a BigQuery-based analytics platform: first the reports leadership relied on most, then self-service dashboards for store and e-commerce teams.
The outcome
In this illustrative scenario, reports are ready every morning from one trusted source, and analysts spend their time answering questions instead of reconciling spreadsheets.
Illustrative results
70%
Time spent preparing weekly reports
Illustrative figure for this example
Estimate
3
Partners compared on one brief
Illustrative figure for this example
Estimate
6 weeks
Selection period
Illustrative figure for this example
Estimate
How the project unfolded
- Week 1
Brief agreed
Goals, data sources and decision criteria were written down.
- Week 3
Proposals compared
Three partners responded to the same brief.
- Week 6
Partner selected
The team met the proposed delivery leads before deciding.
- Month 4
First dashboards live
Leadership reports moved to the new platform first.
What changed

Before
Weekly reports compiled by hand from separate spreadsheets, often late and disputed.

After
One shared dashboard, refreshed every morning, that every team uses.
Inside the work
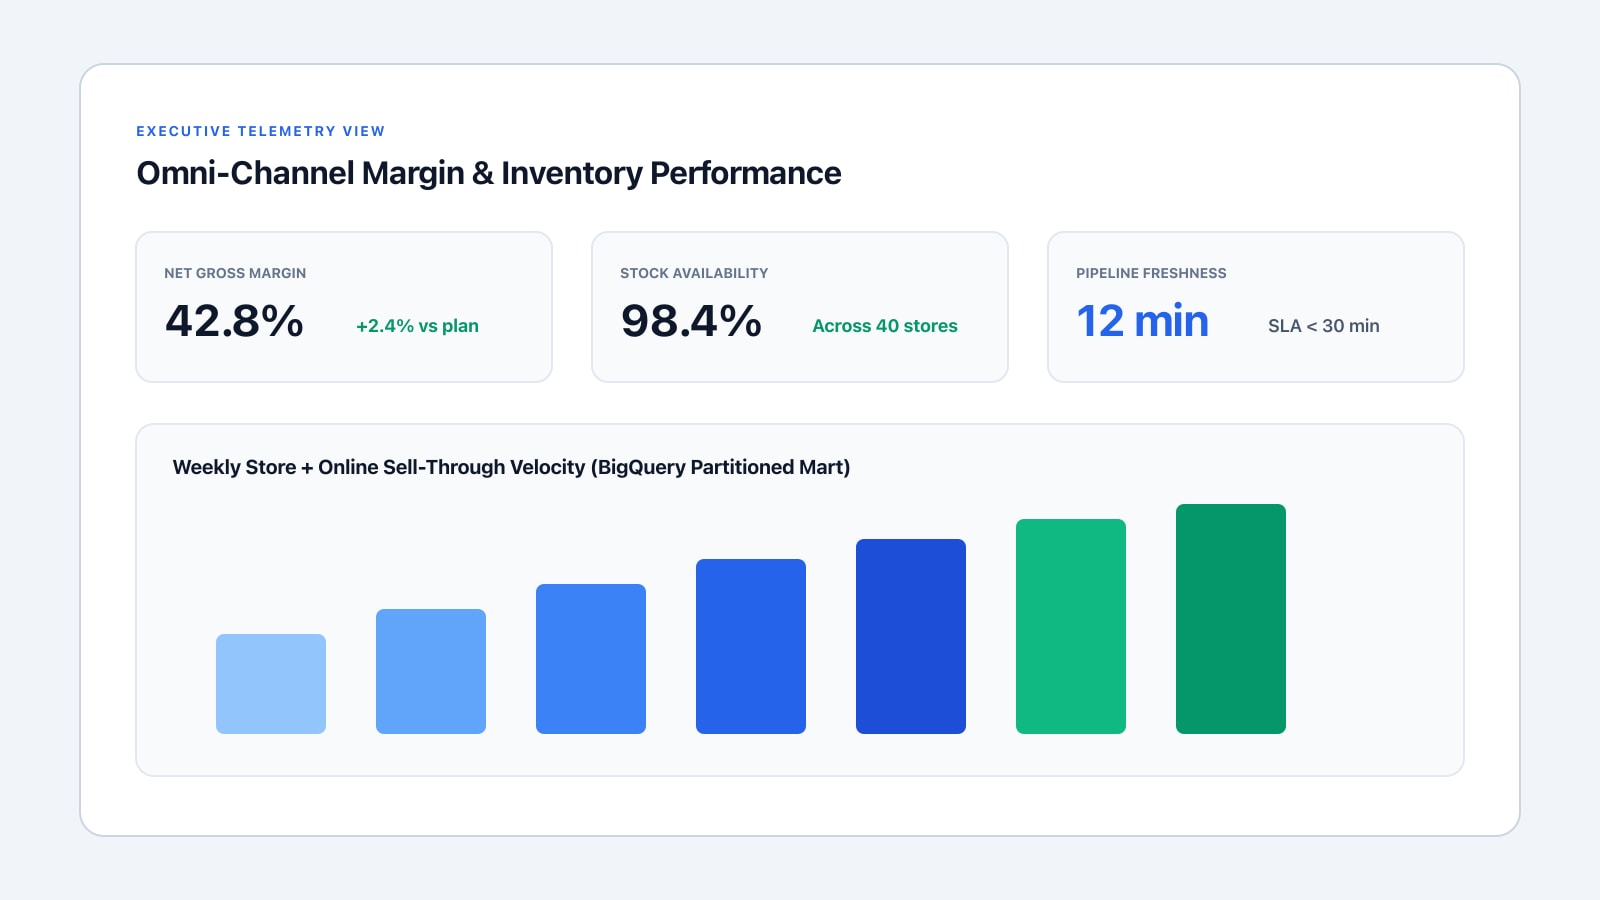
Self-service dashboards for store and online teams. 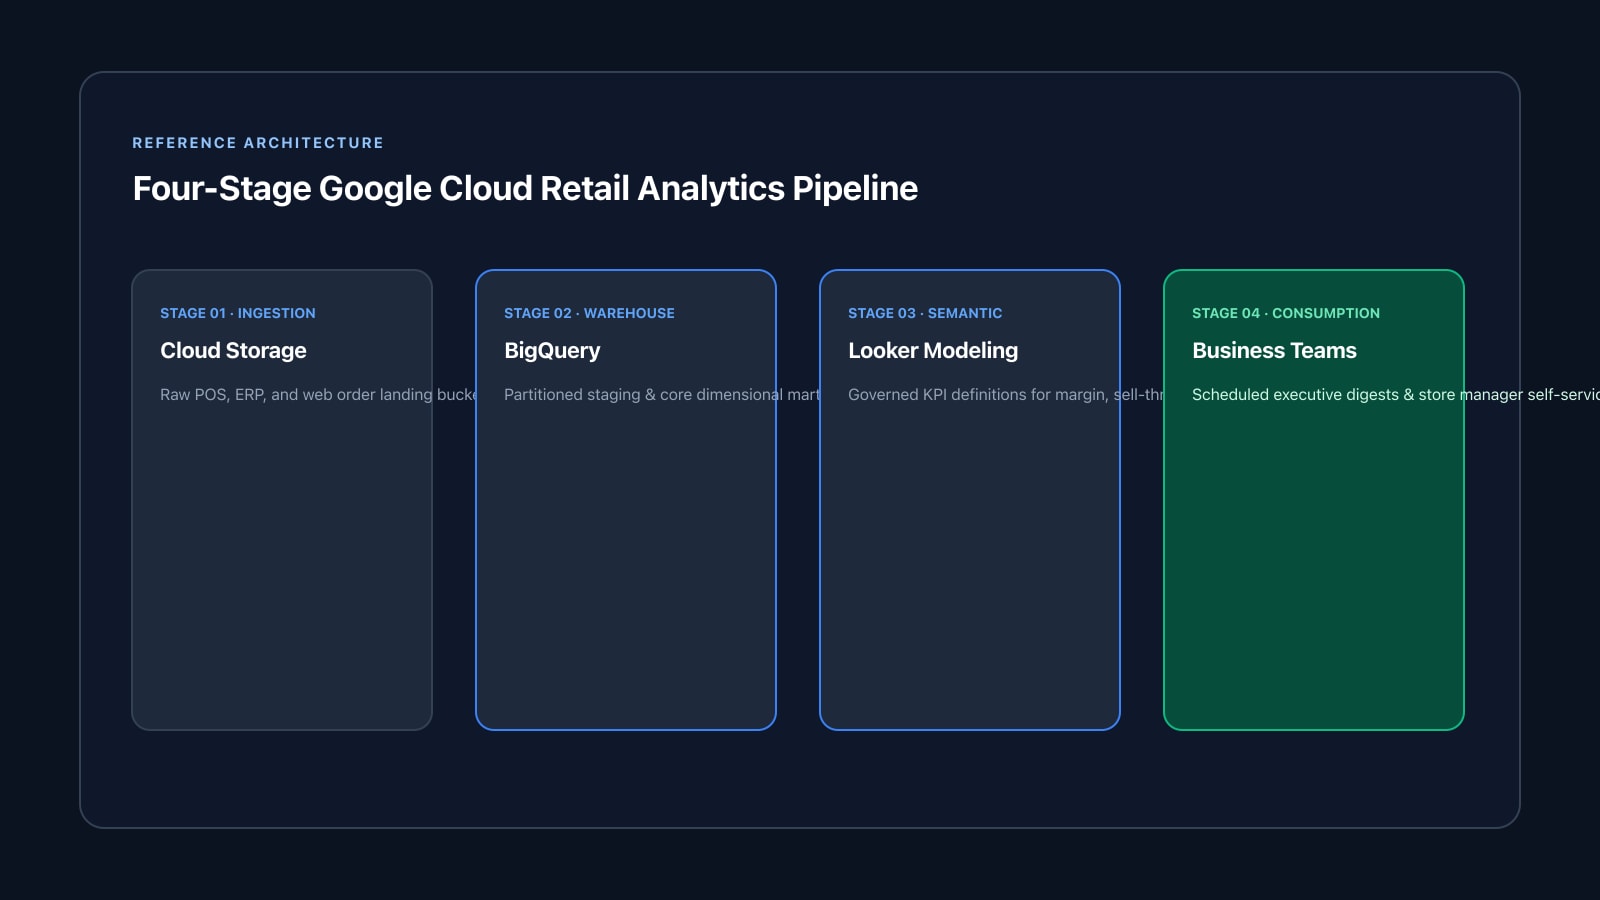
A simplified view of the data platform. 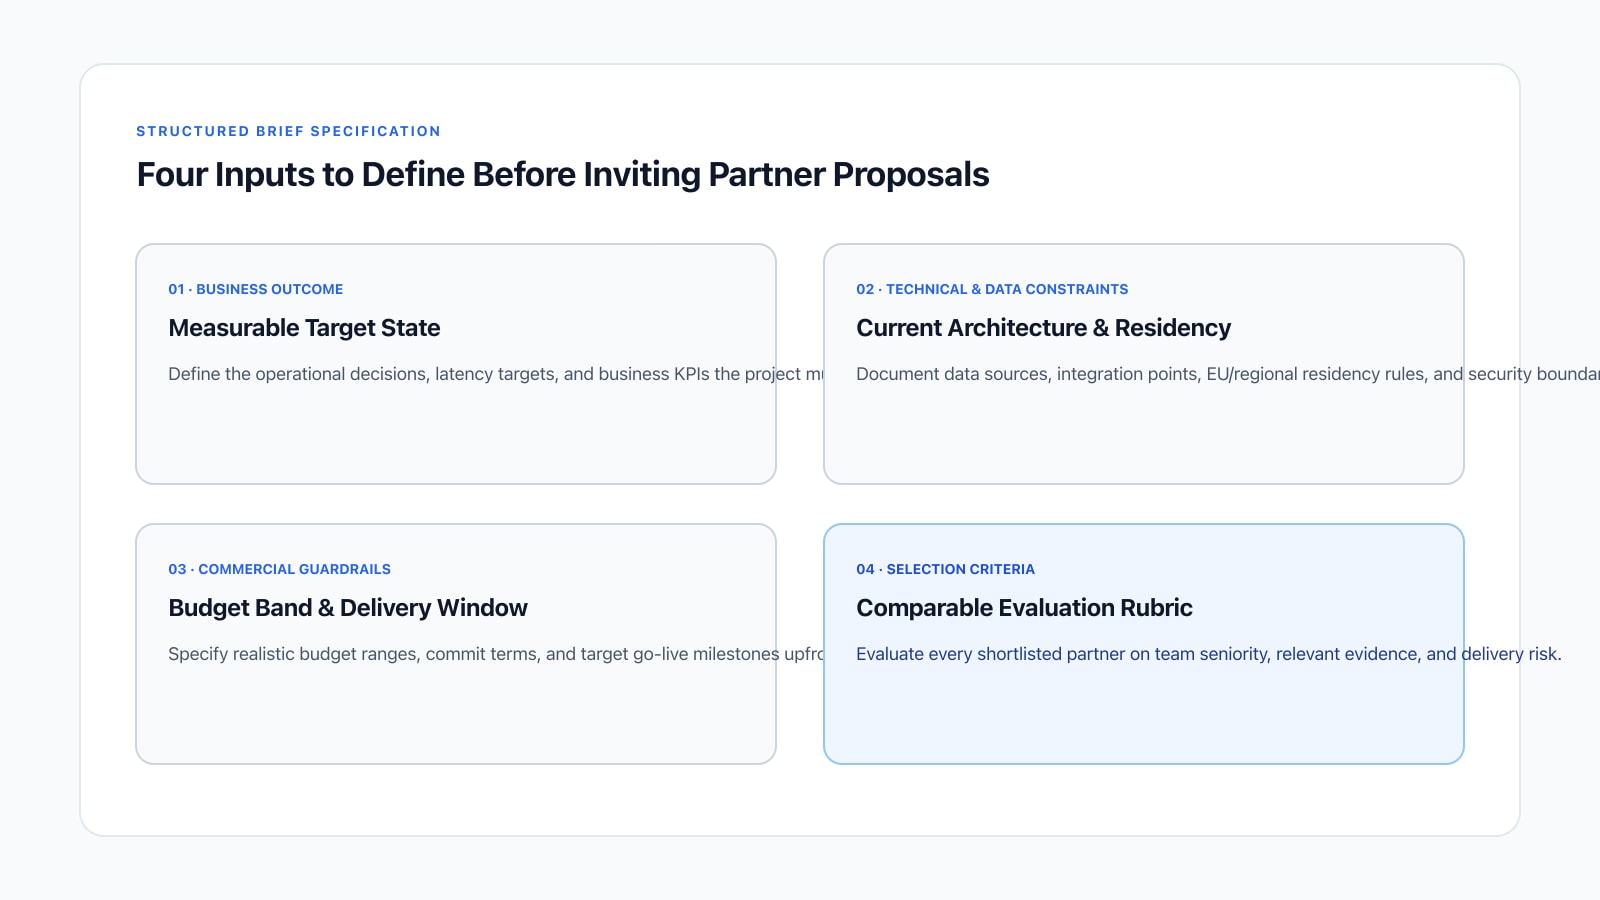
The requirements workshop with business and technology stakeholders.


Scroll horizontally to see 3 images.
For the first time, we compared partners on the same brief and could explain our choice to the board.
Technologies involved
- BigQueryCentral analytics warehouse
- LookerDashboards and self-service reporting
- Cloud StorageLanding zone for exported data
Facing a similar decision?
Describe what you need. AiPartner helps you compare suitable Google Cloud partners before you commit.
Facing a similar challenge?
Describe what you need. aipartner matches you with Google Cloud partners who have delivered it before.
Start a brief